Create INFINITE ART with MATH (and code)
 NalinPlad
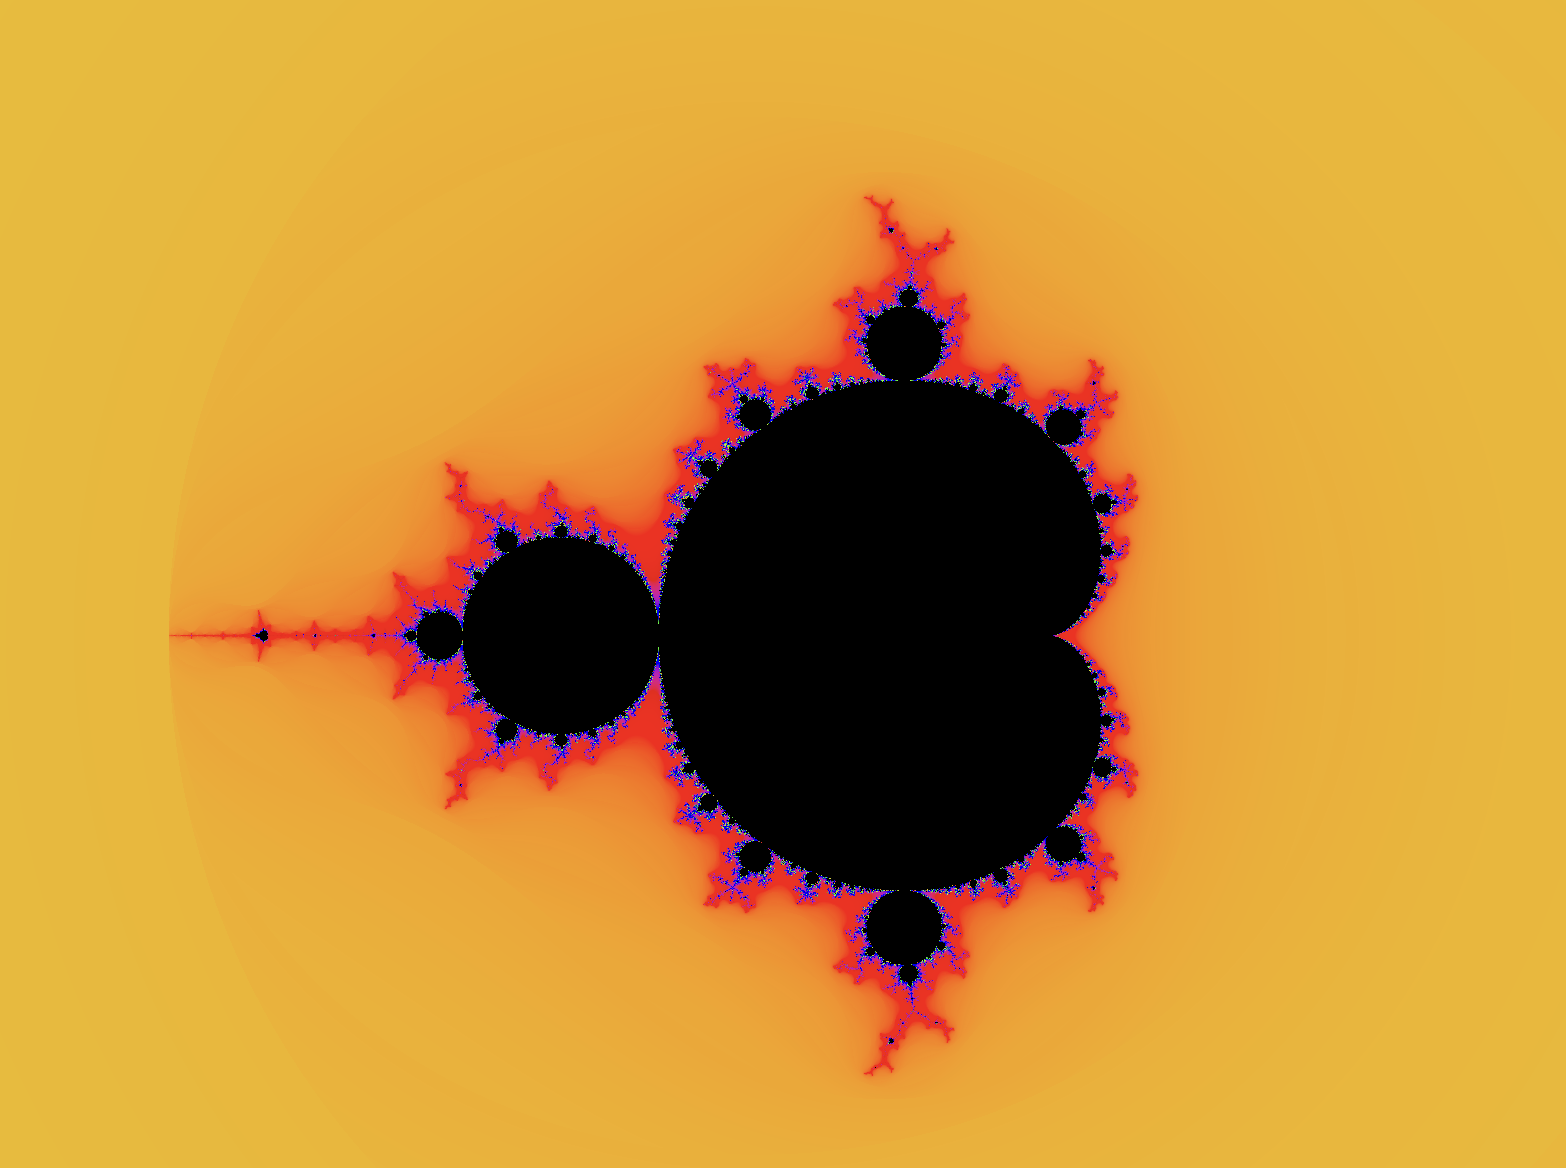
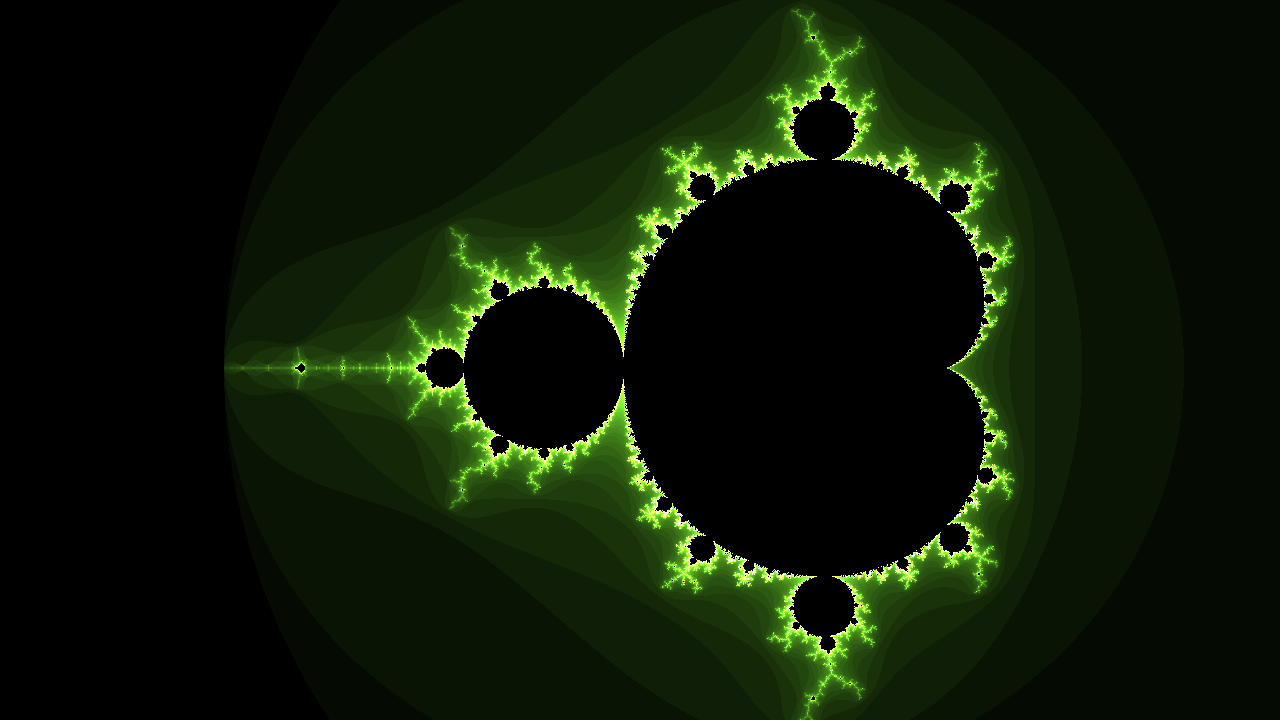
You may have seen or heard of fractals. Even if you haven't, you've probably seen an hour long video of someone zooming into a picture, revealing more and more detail the farther they go.

Well this particular geometrical shape shown in the GIF is part of a large family of infinitely detailed, infinitely precise object, called fractals. Today, we are going to write a computer program that will allow us to create the same fractal you see in the images above, namely, the Mandelbrot set.
The Mandelbrot set is actually very interesting mathematically, and you can learn a lot by implementing a renderer for it. Thats what were going to do today, and you'll find out that theres so much more that you can do with fractals than just zooming in...
Link to example completed project
What is the Mandelbrot set?
The Mandelbrot set is perhaps the most famous fractals ever discovered. We'll start coding soon, but first, we need to learn about the Mandelbrot set and how its derived.
You've probably heard of complex and imaginary numbers before, if not then here's a quick rundown. The imaginary number i is defined as being the square root of -1. You might think about this for a second, and then come to the conclusion of, wait, thats impossible! No number multiplied by itself equals -1, and thats true! No real number exists who's square is -1. Because of this limitation of real numbers, mathematicians created the imaginary number i which is defined as i = √-1.
Complex numbers are just any number that has a real and imaginary component.
a + bi
In that number, a represents the real part, and bi is the imaginary component. A good way to think of complex numbers is like mixed numbers, like "one and three fourths". Mixed numbers have a whole component and a fractional component, just as complex numbers have a real and imaginary component.
So how does this have anything to do with the Mandelbrot set, or fractals in general? Well there's something really cool we can do with these complex numbers.
The Complex Plane
The complex plane is a way to map any complex number to a point on a graph. To understand how it works, first look at this is an ordinary plane, with an ordinary point (point A) located at (4,6)
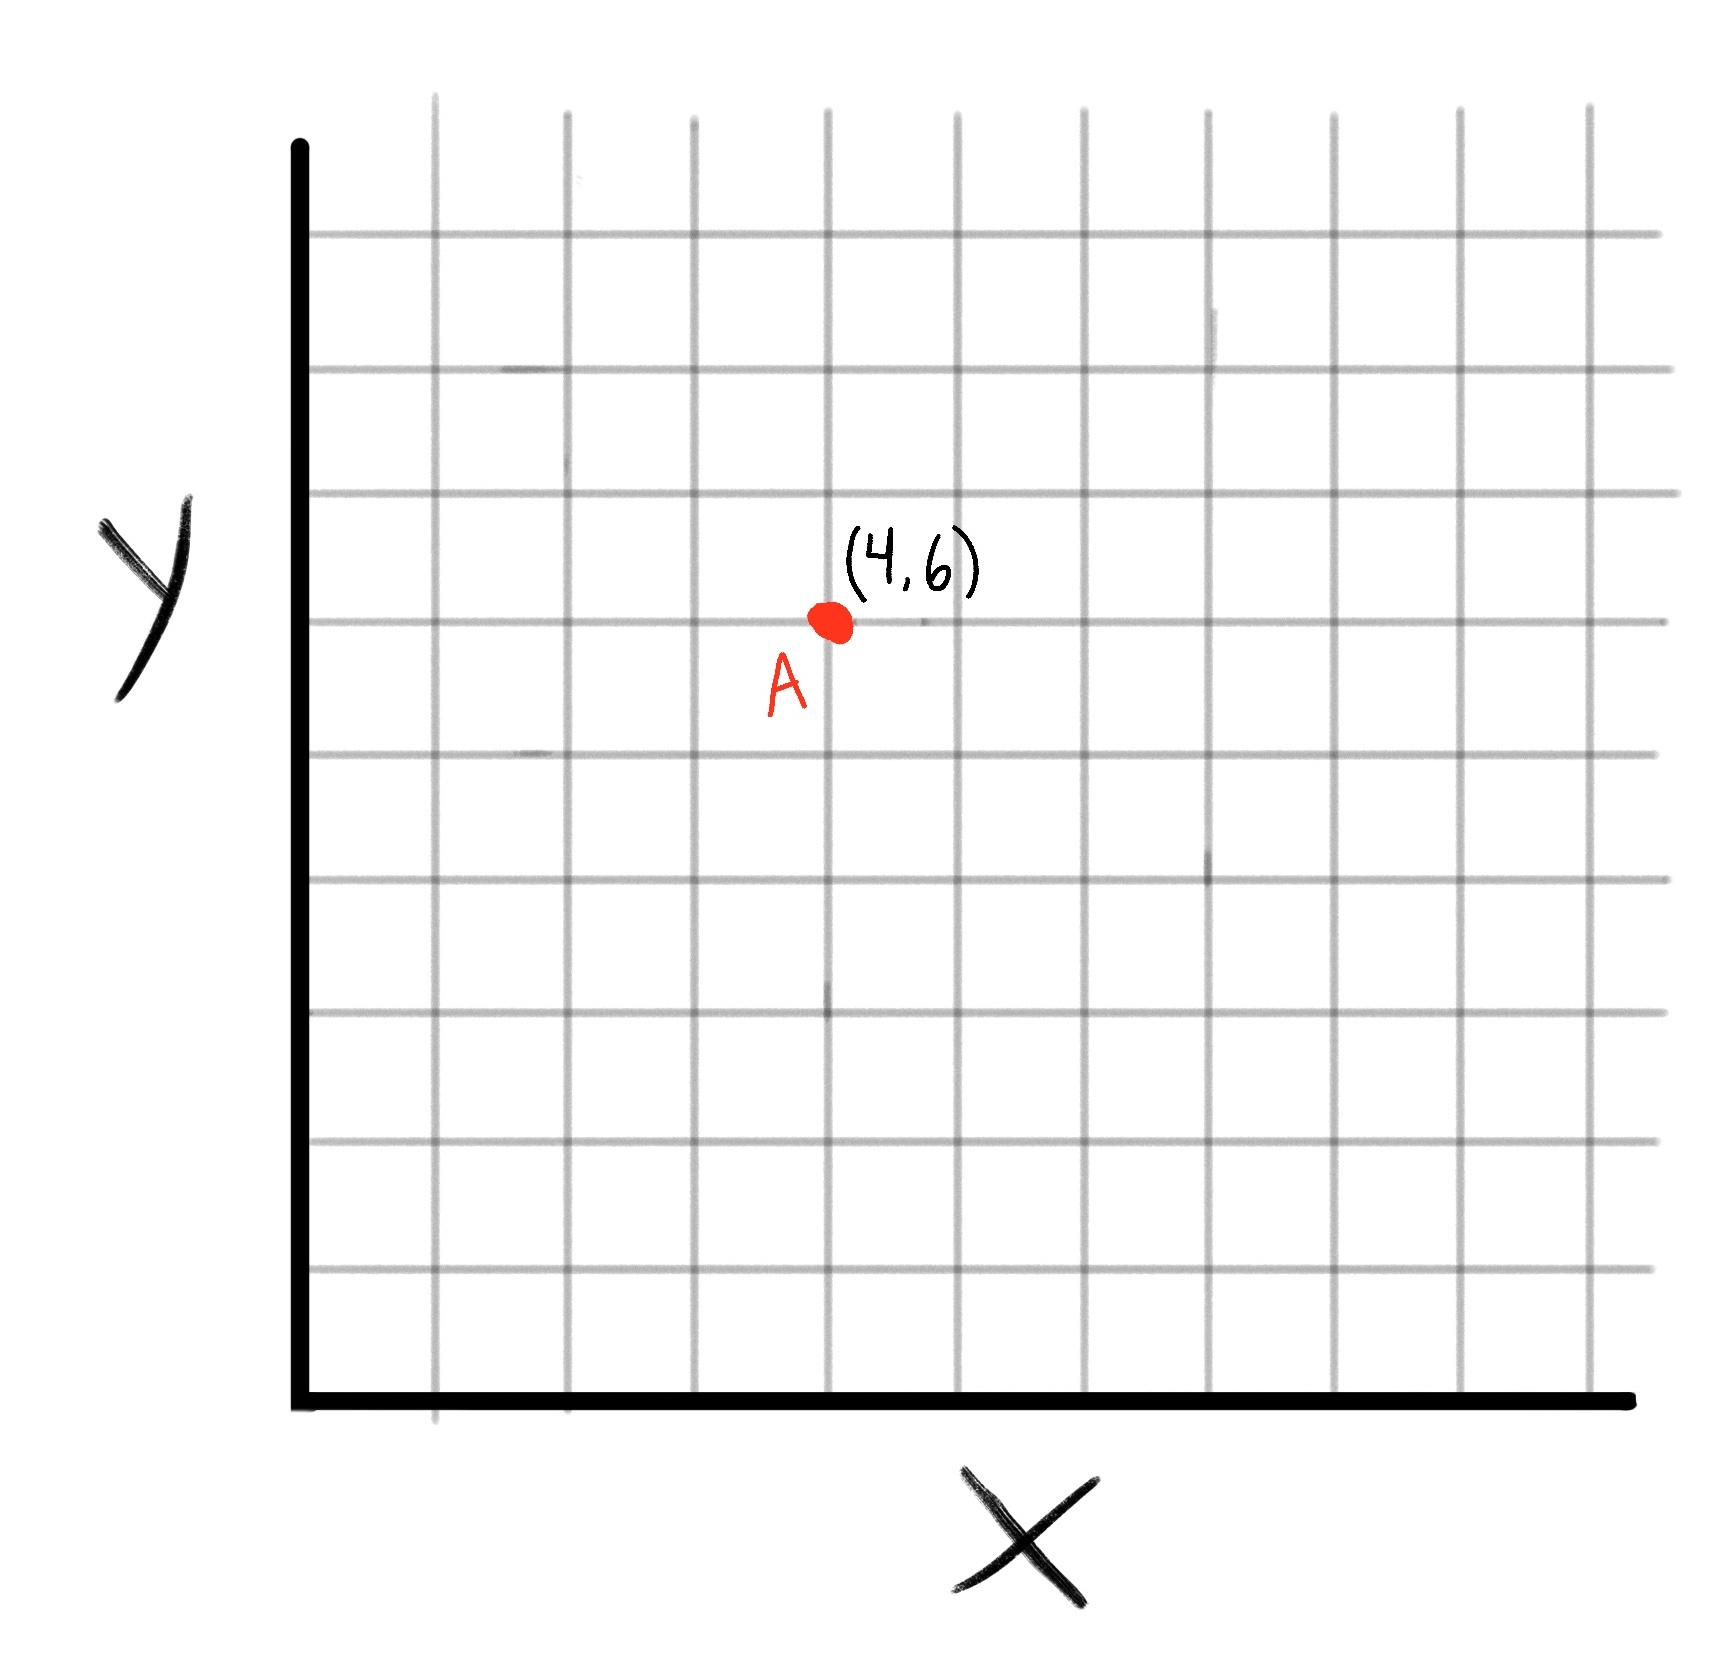
The Complex Plane might sound complex but its just a way of translating any complex number into a point on a graph, and vice versa.
You'll recall that complex numbers have to form a + bi. To get the corresponding point on the plane, just take a as the x value and b as the y value.
For example, if we have the complex number 4 + 6i, it's corresponding point on the complex plane would be (4,6). Simple, right?
Again let me emphasize the form of complex numbers. In a + bi, A is the real part of the complex number, and B is the imaginary part of the complex number
Another way to visualize the complex plane is to rename the axes from the image above.
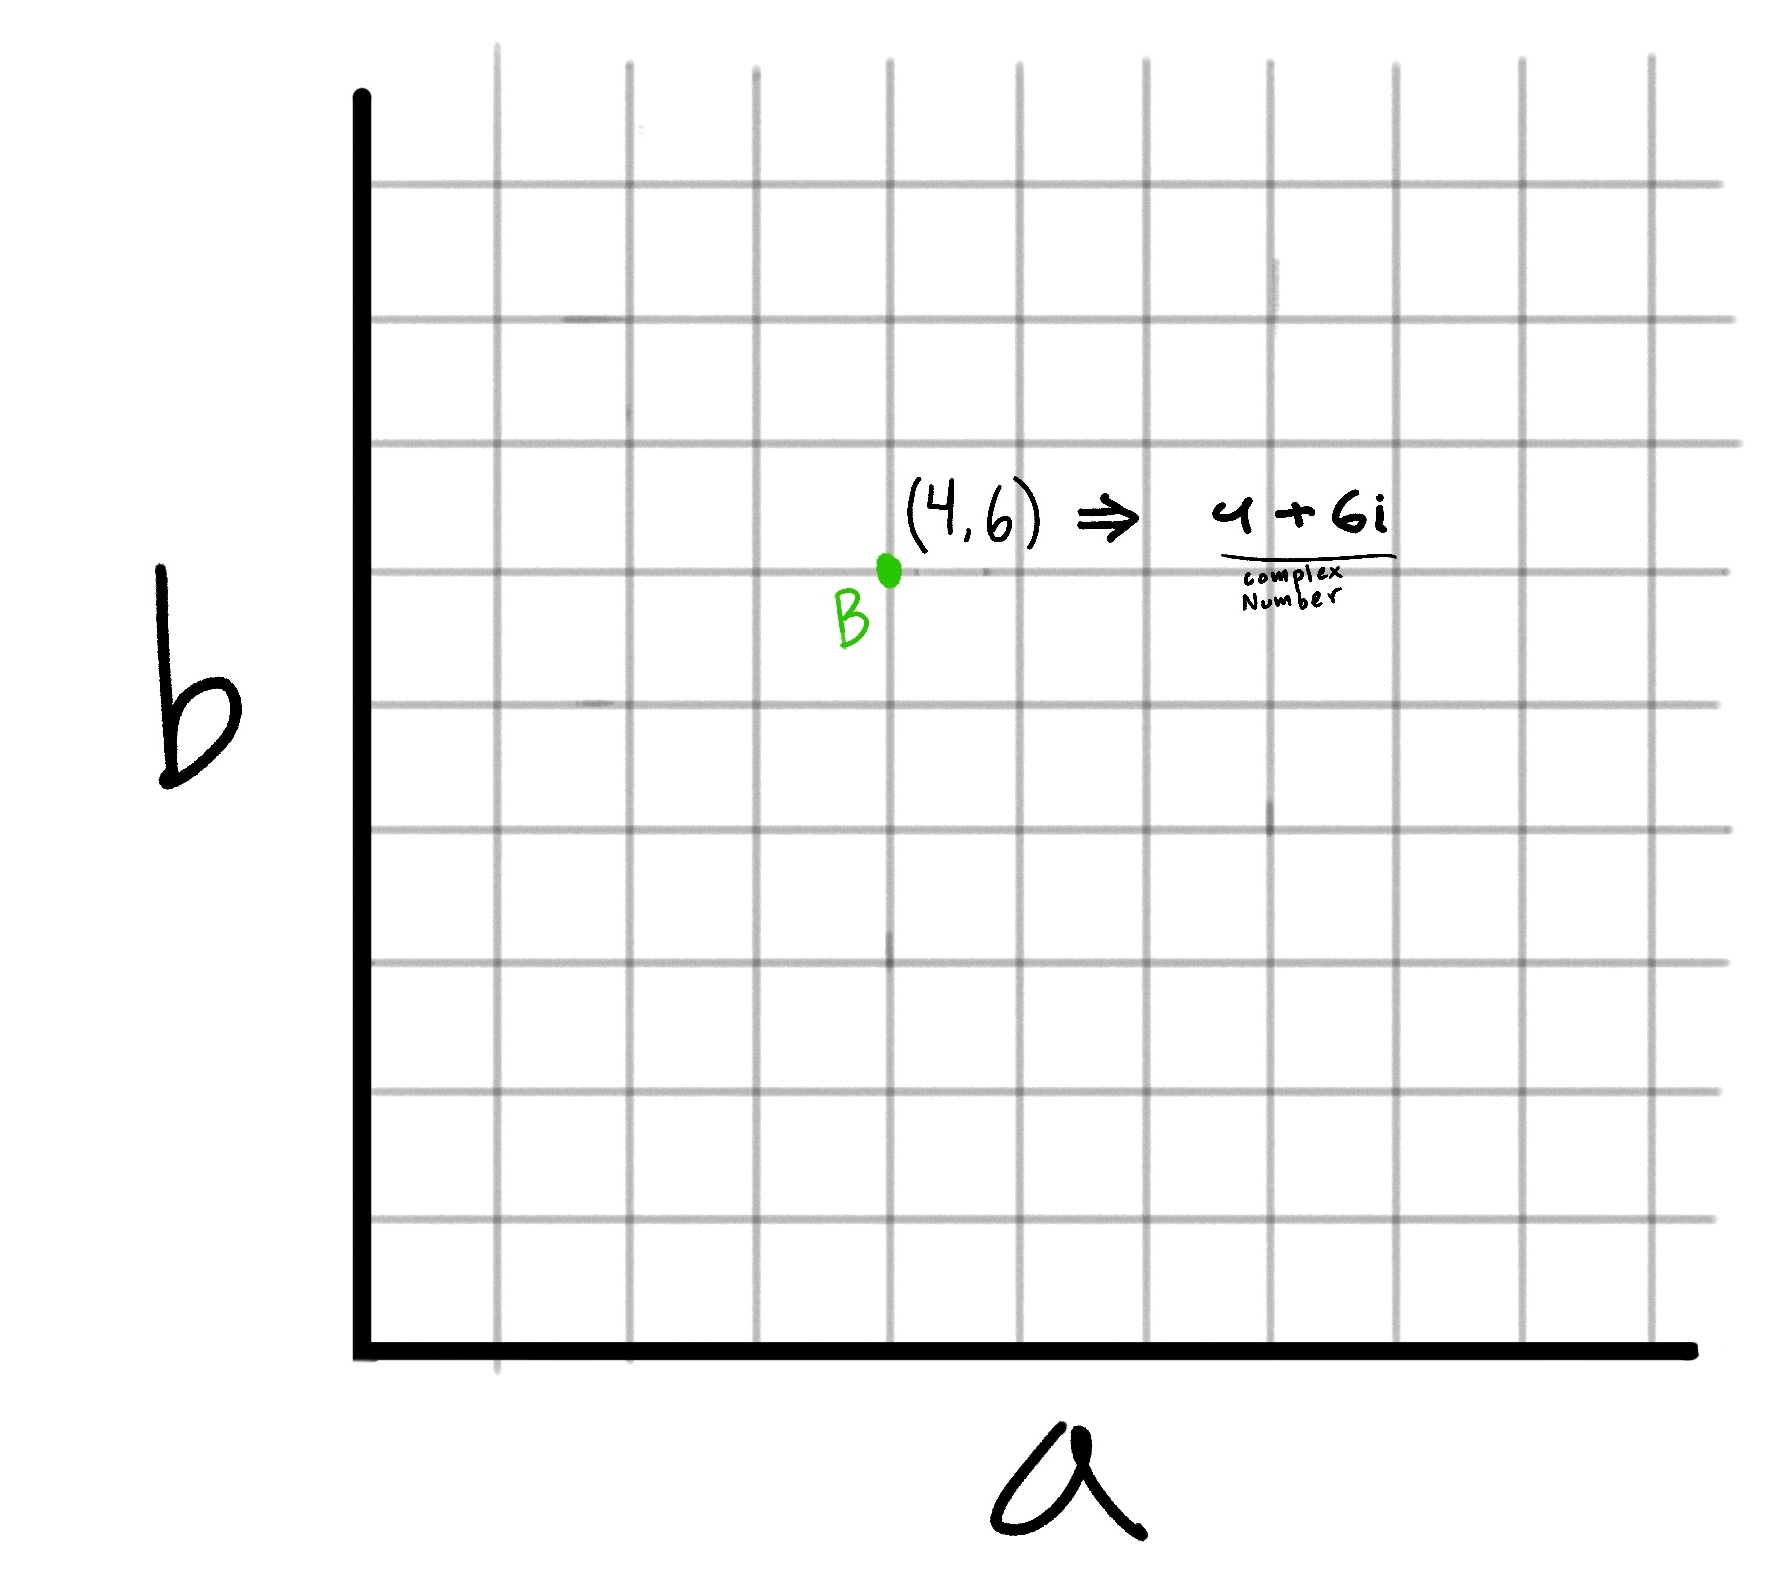
Now you can see how the point (4,6) on the plane translates to the complex number 4 + 6i
So now we have this method of converting any complex number to a point on the complex plane. So what can we do with that?
Well this is where the actual formula for the Mandelbrot set comes in.
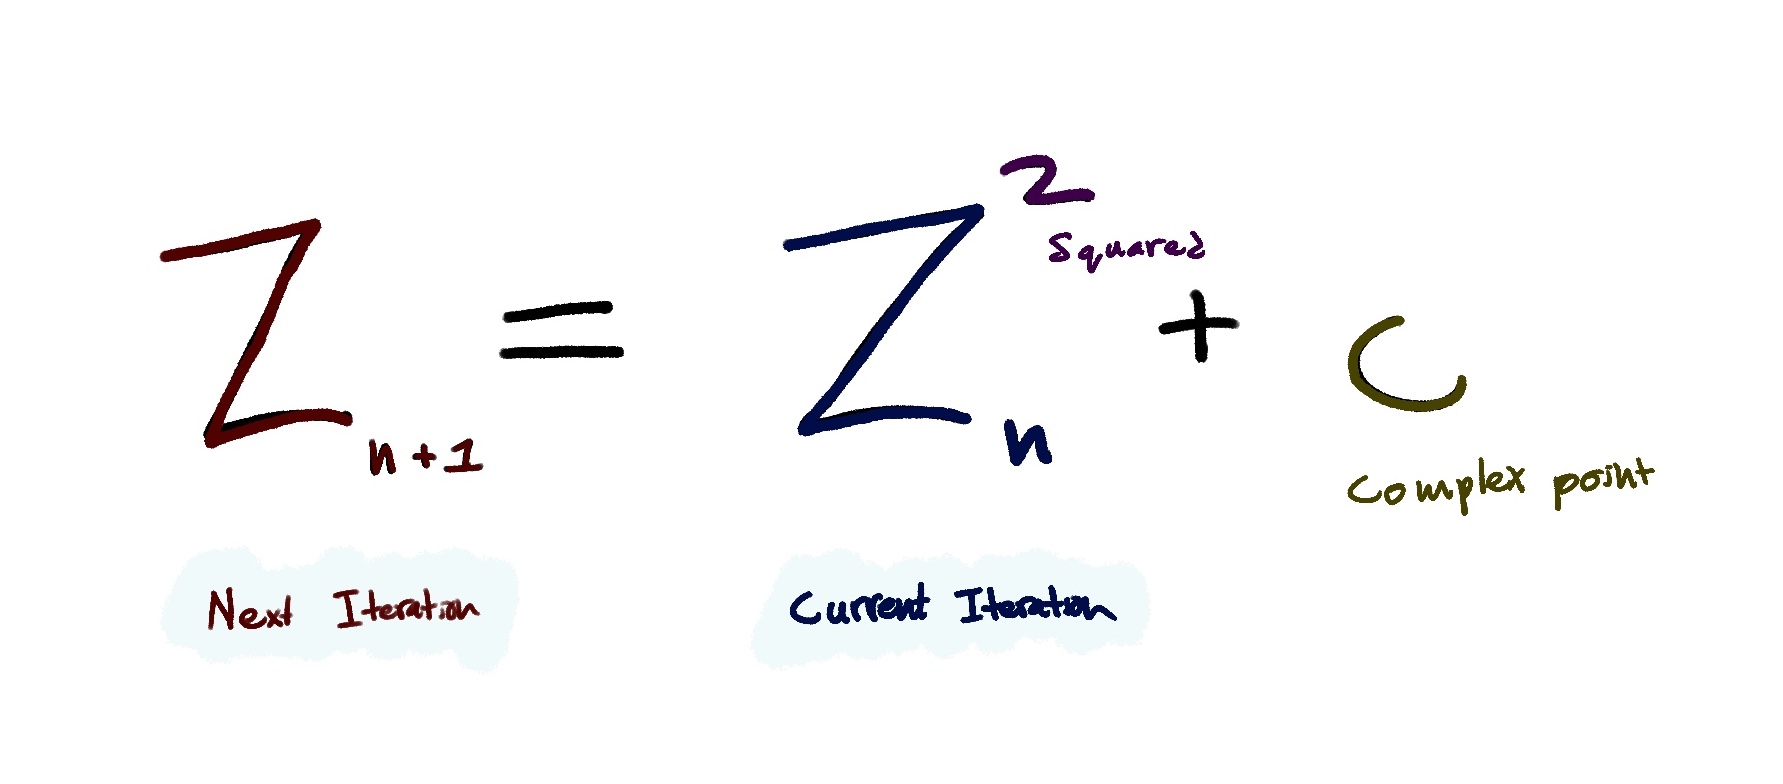
This might look pretty scary at first, but I promise it will make sense soon. First of all, what even is this? Essentially, this equation is a formula that we recursively apply to a complex number(like 2 + 3i or 5 + 2i).
Let me walk you through the steps of the equation. This equation essentially just tell you how to calculate the next number in a sequence, so we kind of need a sequence to start with. Lets initialize one that just starts with the value of zero
Our sequence => 0
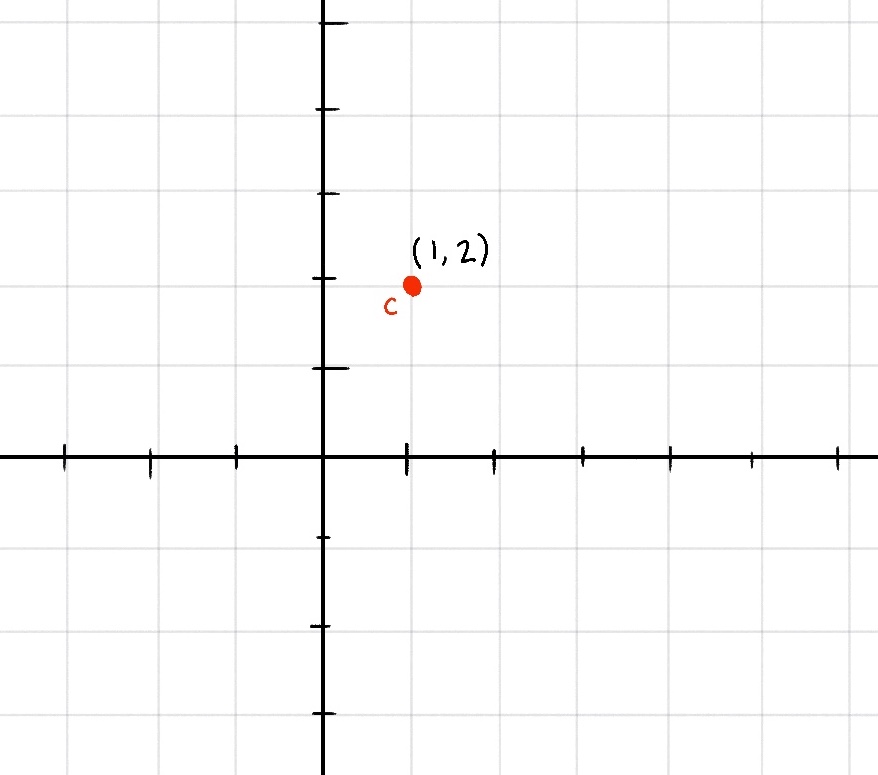
Now this formula needs an input. That input is a complex number. As you can recall we can take any point on the plane and use it as a complex number. So lets choose the point (1,2), which corresponds to the complex number 1 + 2i. Let's call this point C
Now to find the next number in the sequence, the formula states we
- Take the last number in the sequence and Square it
- Add a complex number C to the result
So lets do that;
Currently our sequence is just [0] so in this case, 0 is the last number in the sequence, and for the complex number, ours is 1 + 2i. So our equation for the next number in the sequence is
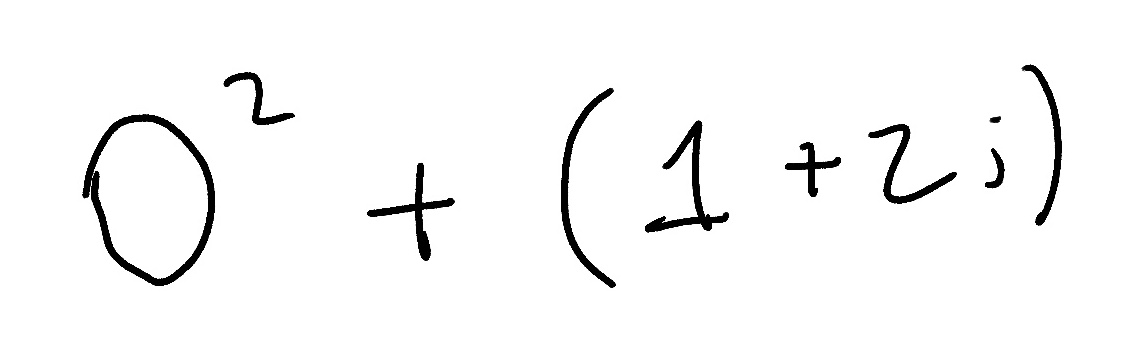
The zero can be discarded and we are left with (1 + 2i)
Our sequence => 0, 1 + 2i
Now lets repeat that. Now to find the third number in the sequence, we take the square of the last number(which is what we just found), and add our complex number C to it.
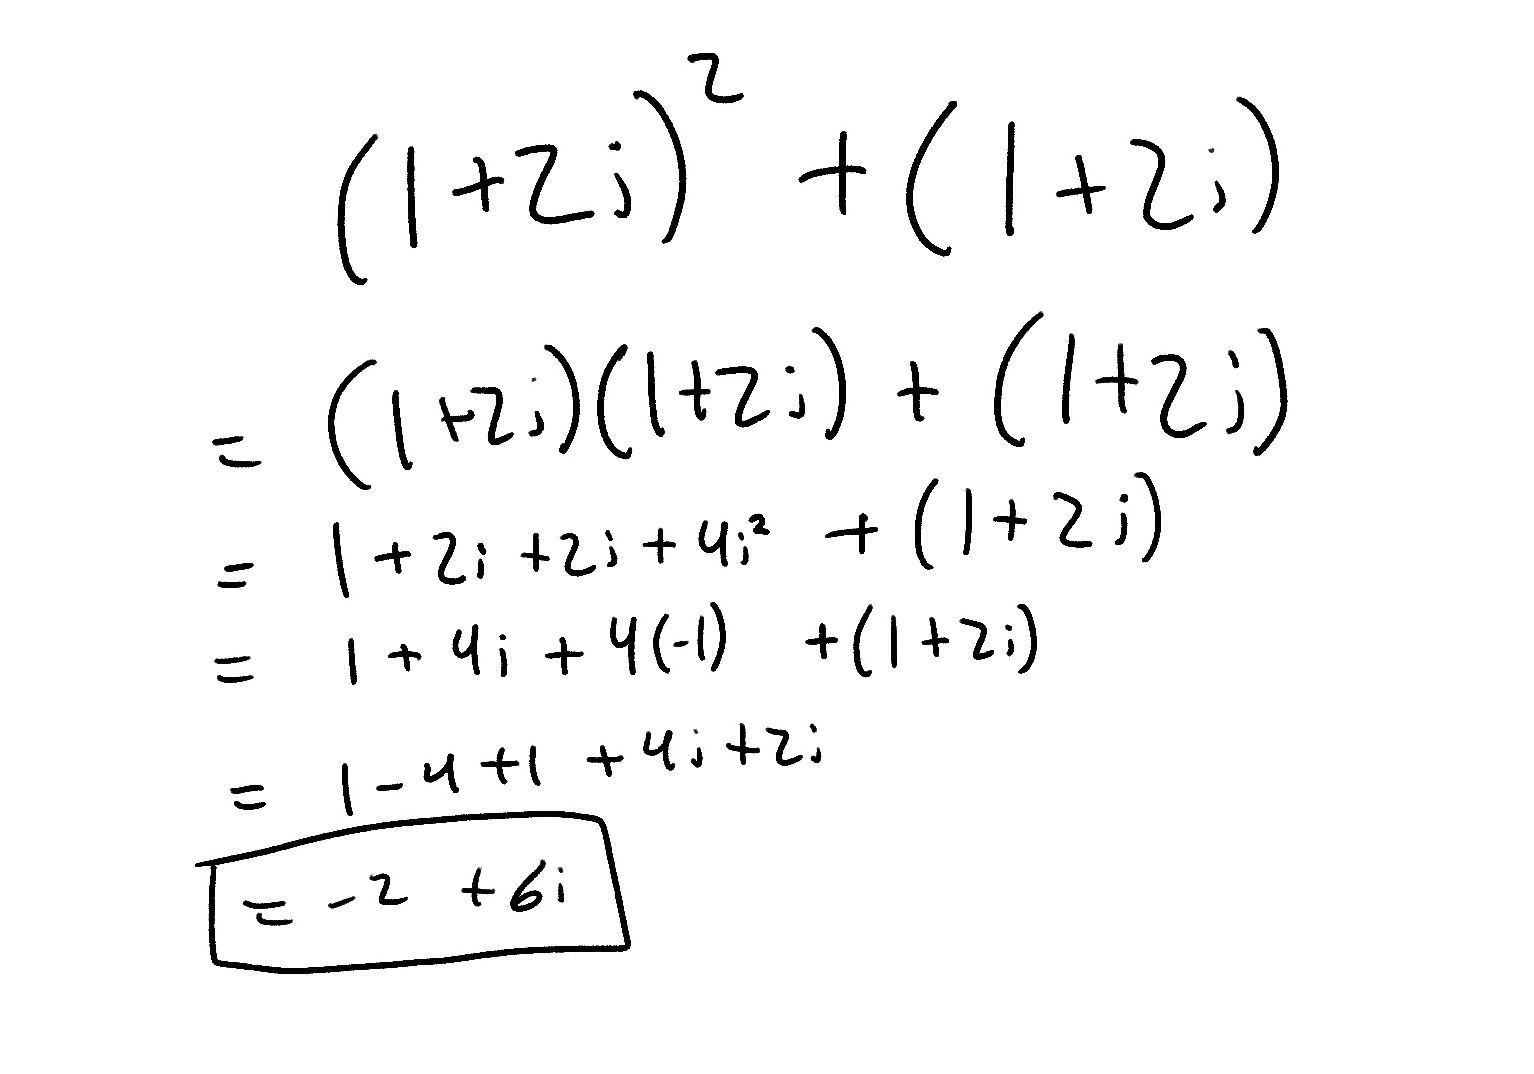
Wow! That's a lot longer than then the previous iteration, but thats only because we are squaring a complex number now. As you can see, we basically treat i as any normal algebriac variable, except for one special case.
Hopefully you recall how i is defined
i = √-1
i^2 = -1
This just means that we need to convert i^2 to -1 whenever we see it in our math
(don't worry the computer will take care of all of this once we code it ;)
Now our sequence looks like this
Our sequence => 0, 1 + 2i, -2 + 6i
We can also plot this new point on the complex plane (as well as our starting point of 0)
Very soon we'll see some emergent behavior from this system, but first lets quickly do one more iteration
(Only look at this next equation if you really care)
Our sequence => 0, 1 + 2i, -2 + 6i, -31 - 22i
Now our graph looks like this:
Well there goes our point... At this point its obvious that if we continue this sequence it will eventually spiral out to infinity. So we can classify this point as... Drumroll please..... Not in the Mandelbrot set!!!!

Ok, lets back up. First, we chose and arbitrary point on the complex plane: (1,2). Then we recursively called the Mandelbrot Equation on it. On every iteration we graphed the points new position and saw that as we ran the function for more and more iterations, the point was quickly escaping the graph and heading out towards infinity.
So back to what I was saying about this point not being in the Mandelbrot set. (This next part is an important key concept so listen up)
Any point on the complex plane will either blow up to infinity or fall into some sort of stable orbit
To see what I mean, lets try a different point. This time I'll leave out all of the equations behind the scenes and just show you the end graph.
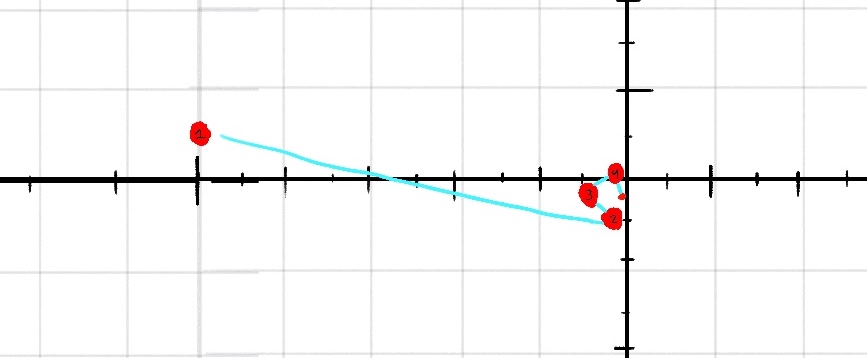
You can see that instead of escaping out into infinity, this point seems to do the opposite, and sort of falls in towards the center and floats around. This type of point, one that does not explode out into infinity, is in the Mandelbrot set.
Intro to Shadertoy
At long last, its time to take all of our newly gained knowledge and make something out of it. We're going to be using Shader Toy, which is kind of like replit for high performance graphics shaders. Shader Toy lets us write GLSL shaders that run on the GPU.
GLSL is the language of WebGL, which is a technology that allows developers to write high performance graphics on the web.
Go to shadertoy.com and sign up for an account. You can complete this Jam without an account if you want, but if you want to share your finished product or save your shader, you need to sign up for a free account.
Once you are logged in, click the New button in the top right.

After you click that, you'll land on a page that looks like this
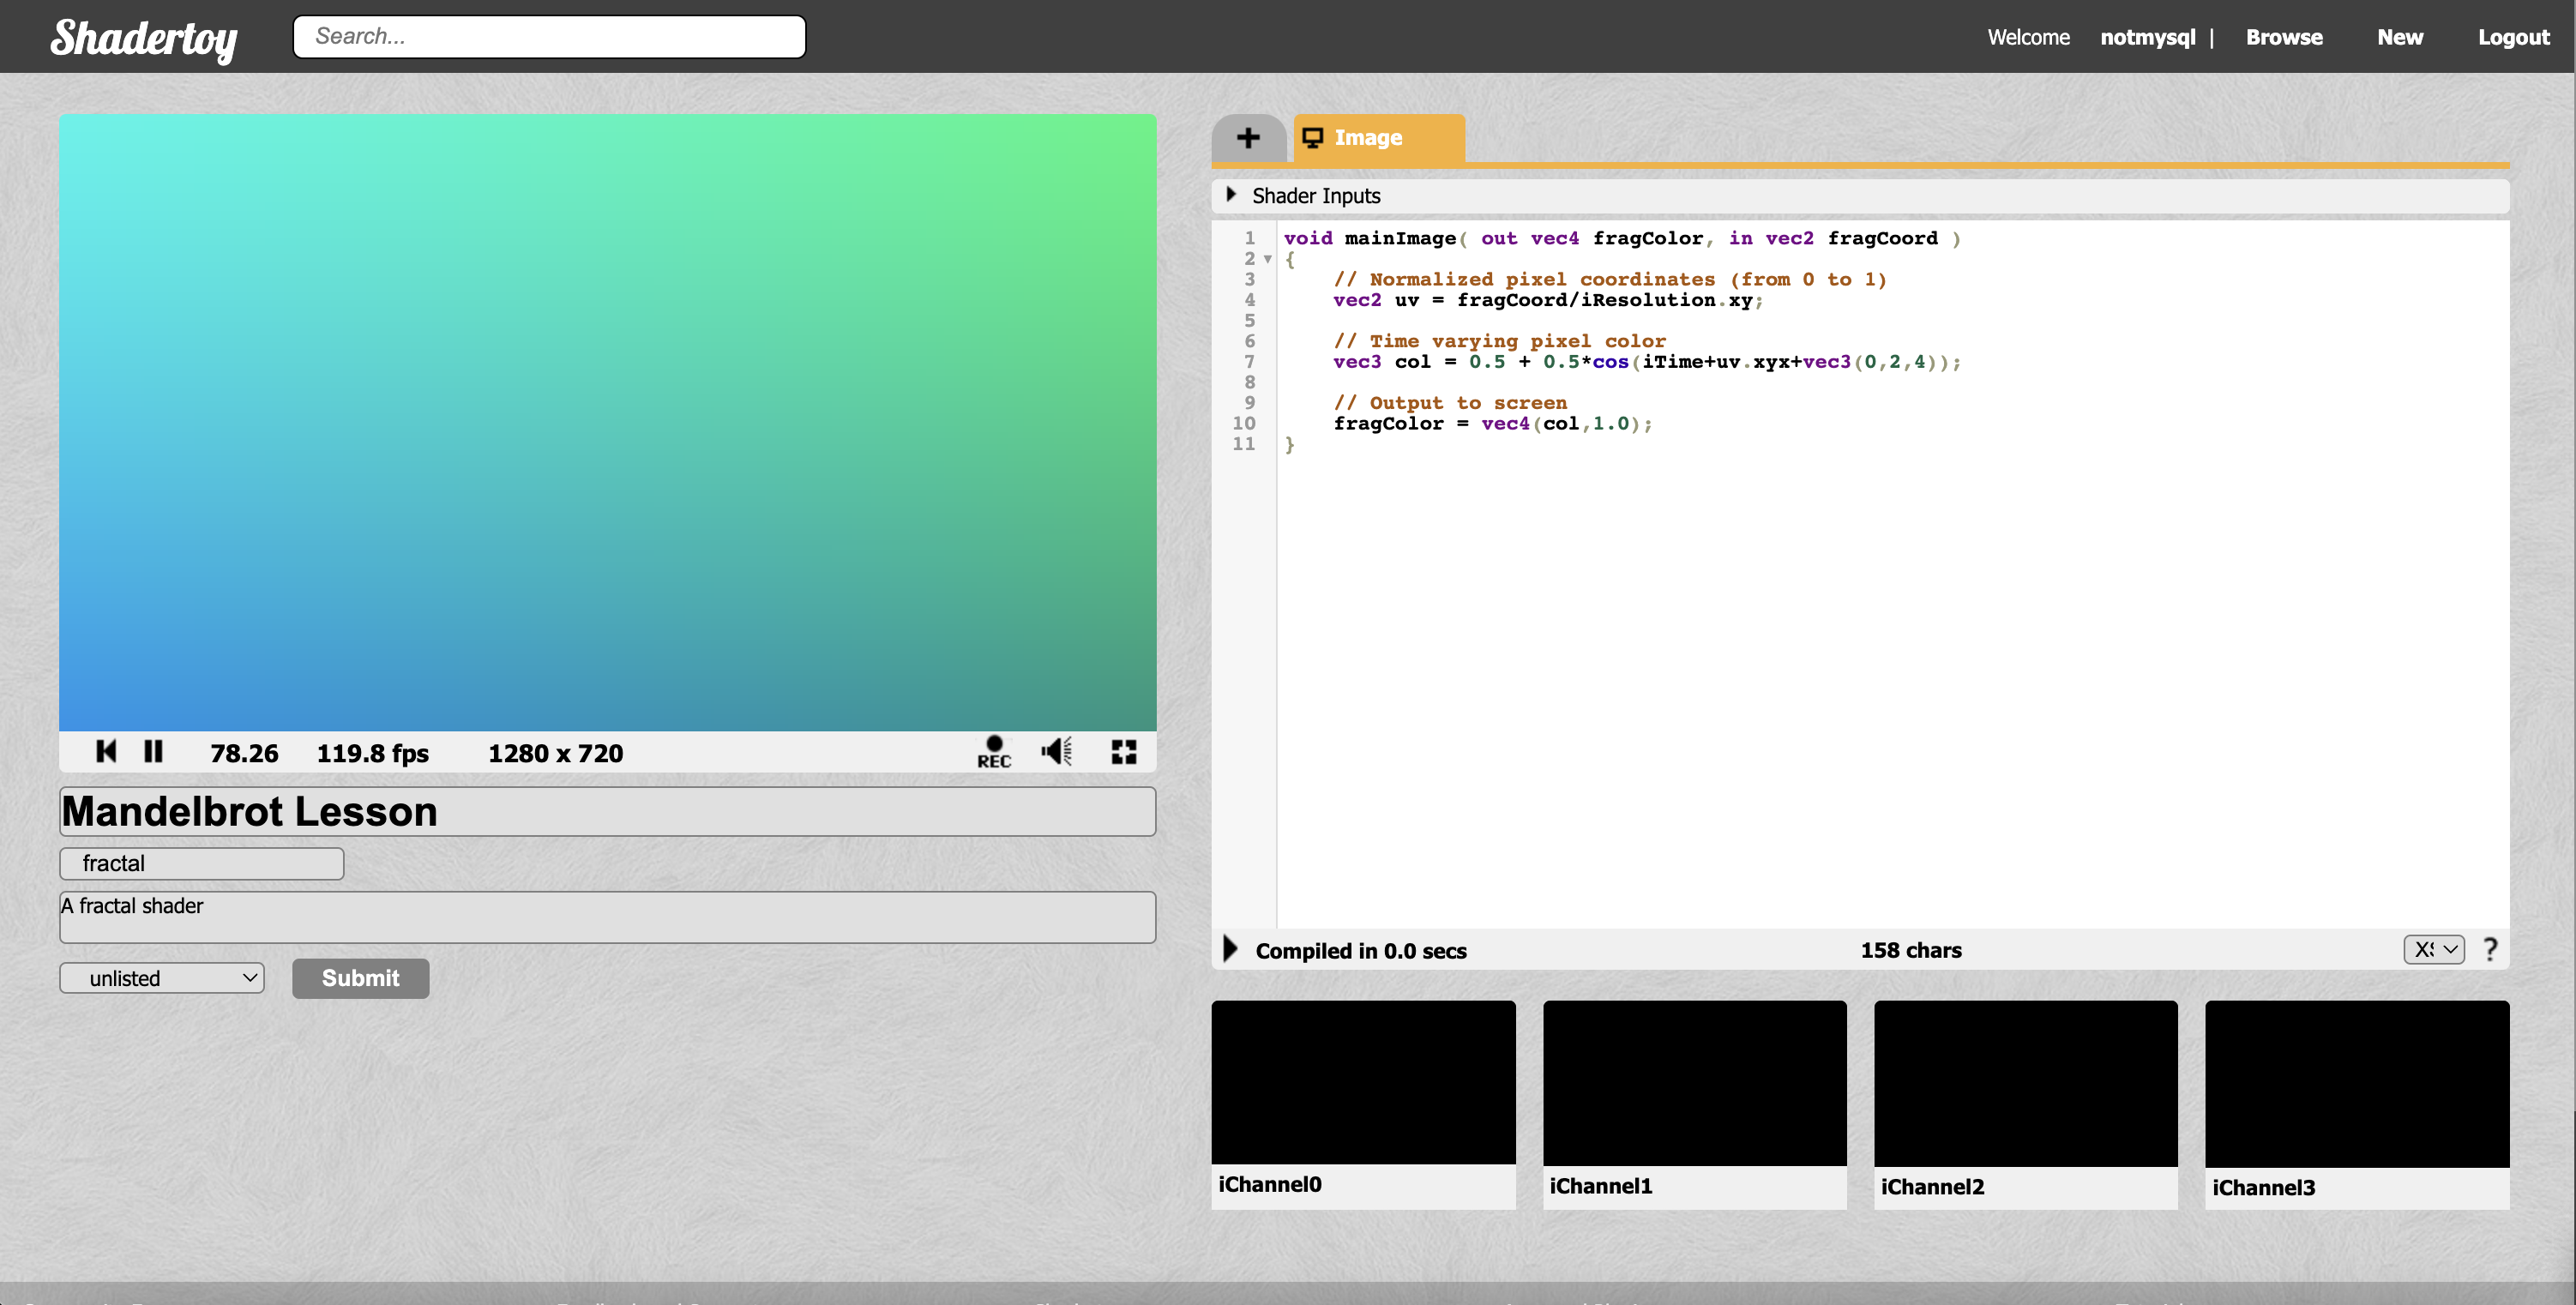
I've gone ahead and filled out the Title and Description for this Jam. Now lets get into GLSL!
Intro to GLSL
We can see that we have a default starter shader already loaded. We're going to start from scratch so begin by replacing all the code in the code box with the following basic script. Make sure to recompile by clicking the play button at the bottom left of the code box.
void mainImage( out vec4 fragColor, in vec2 fragCoord )
{
    // Normalized pixel coordinates (from 0 to 1)
    vec2 uv = fragCoord/iResolution.xy;

    // Output to screen
    fragColor = vec4(0.0, 0.0, 0.0, 1.0);
}
Here we can see our main function. This function will be run for every pixel in our image. Lets walk through the lines.
void mainImage( out vec4 fragColor, in vec2 fragCoord )
This defines the main function. mainImage() is the convention in ShaderToy. We can see that we are outputting a single vec4 variable named fragColor, and have access to one vec2 variable named fragCoord.
fragCoord is the basic input to the shader and is different for every pixel. It is basically just a vec2 containing the x and y position of the current pixel.
Okay, before we continue, I haven't explained what vectors are, so lets do that quickly;
What are vectors
Throughout this Jam, and whenever programming in GLSL, you'll see countless examples of Vectors being used. vec is a datatype that is used very prominently in GLSL. They each contain either 2, 3, or 4 entries.
// Vectors example

// 2D Vector
vec2 position = vec2(2.0, 3.0)

position.x // => 2.0
position.y // => 3.0

// OR

position[0] // => 2.0
position[1] // => 3.0


// 3D Vector
vec3 position_3D = vec3(2.0, 5.3, 1.0)

position_3D.x // => 2.0
position_3D.y // => 5.3
position_3D.z // => 1.0
Okay, now back to the shader code
// Normalized pixel coordinates (from 0 to 1)
vec2 uv = fragCoord/iResolution.xy;
This line just normalizes our coordinates. If we just use the input to the function, fragCoord, the values would be from 1 - width/height of screen, which would be different for every computer and browser running our program. To solve this, we can use ShaderToy's built in variable iResolution to get the screens resolution, and divide fragCoord by it. Now we have a new variable, uv, which is the current pixels position on the screen, normalized so that all the values fall between 0 and 1.
Heres a simple diagram to show what uv coordinates are
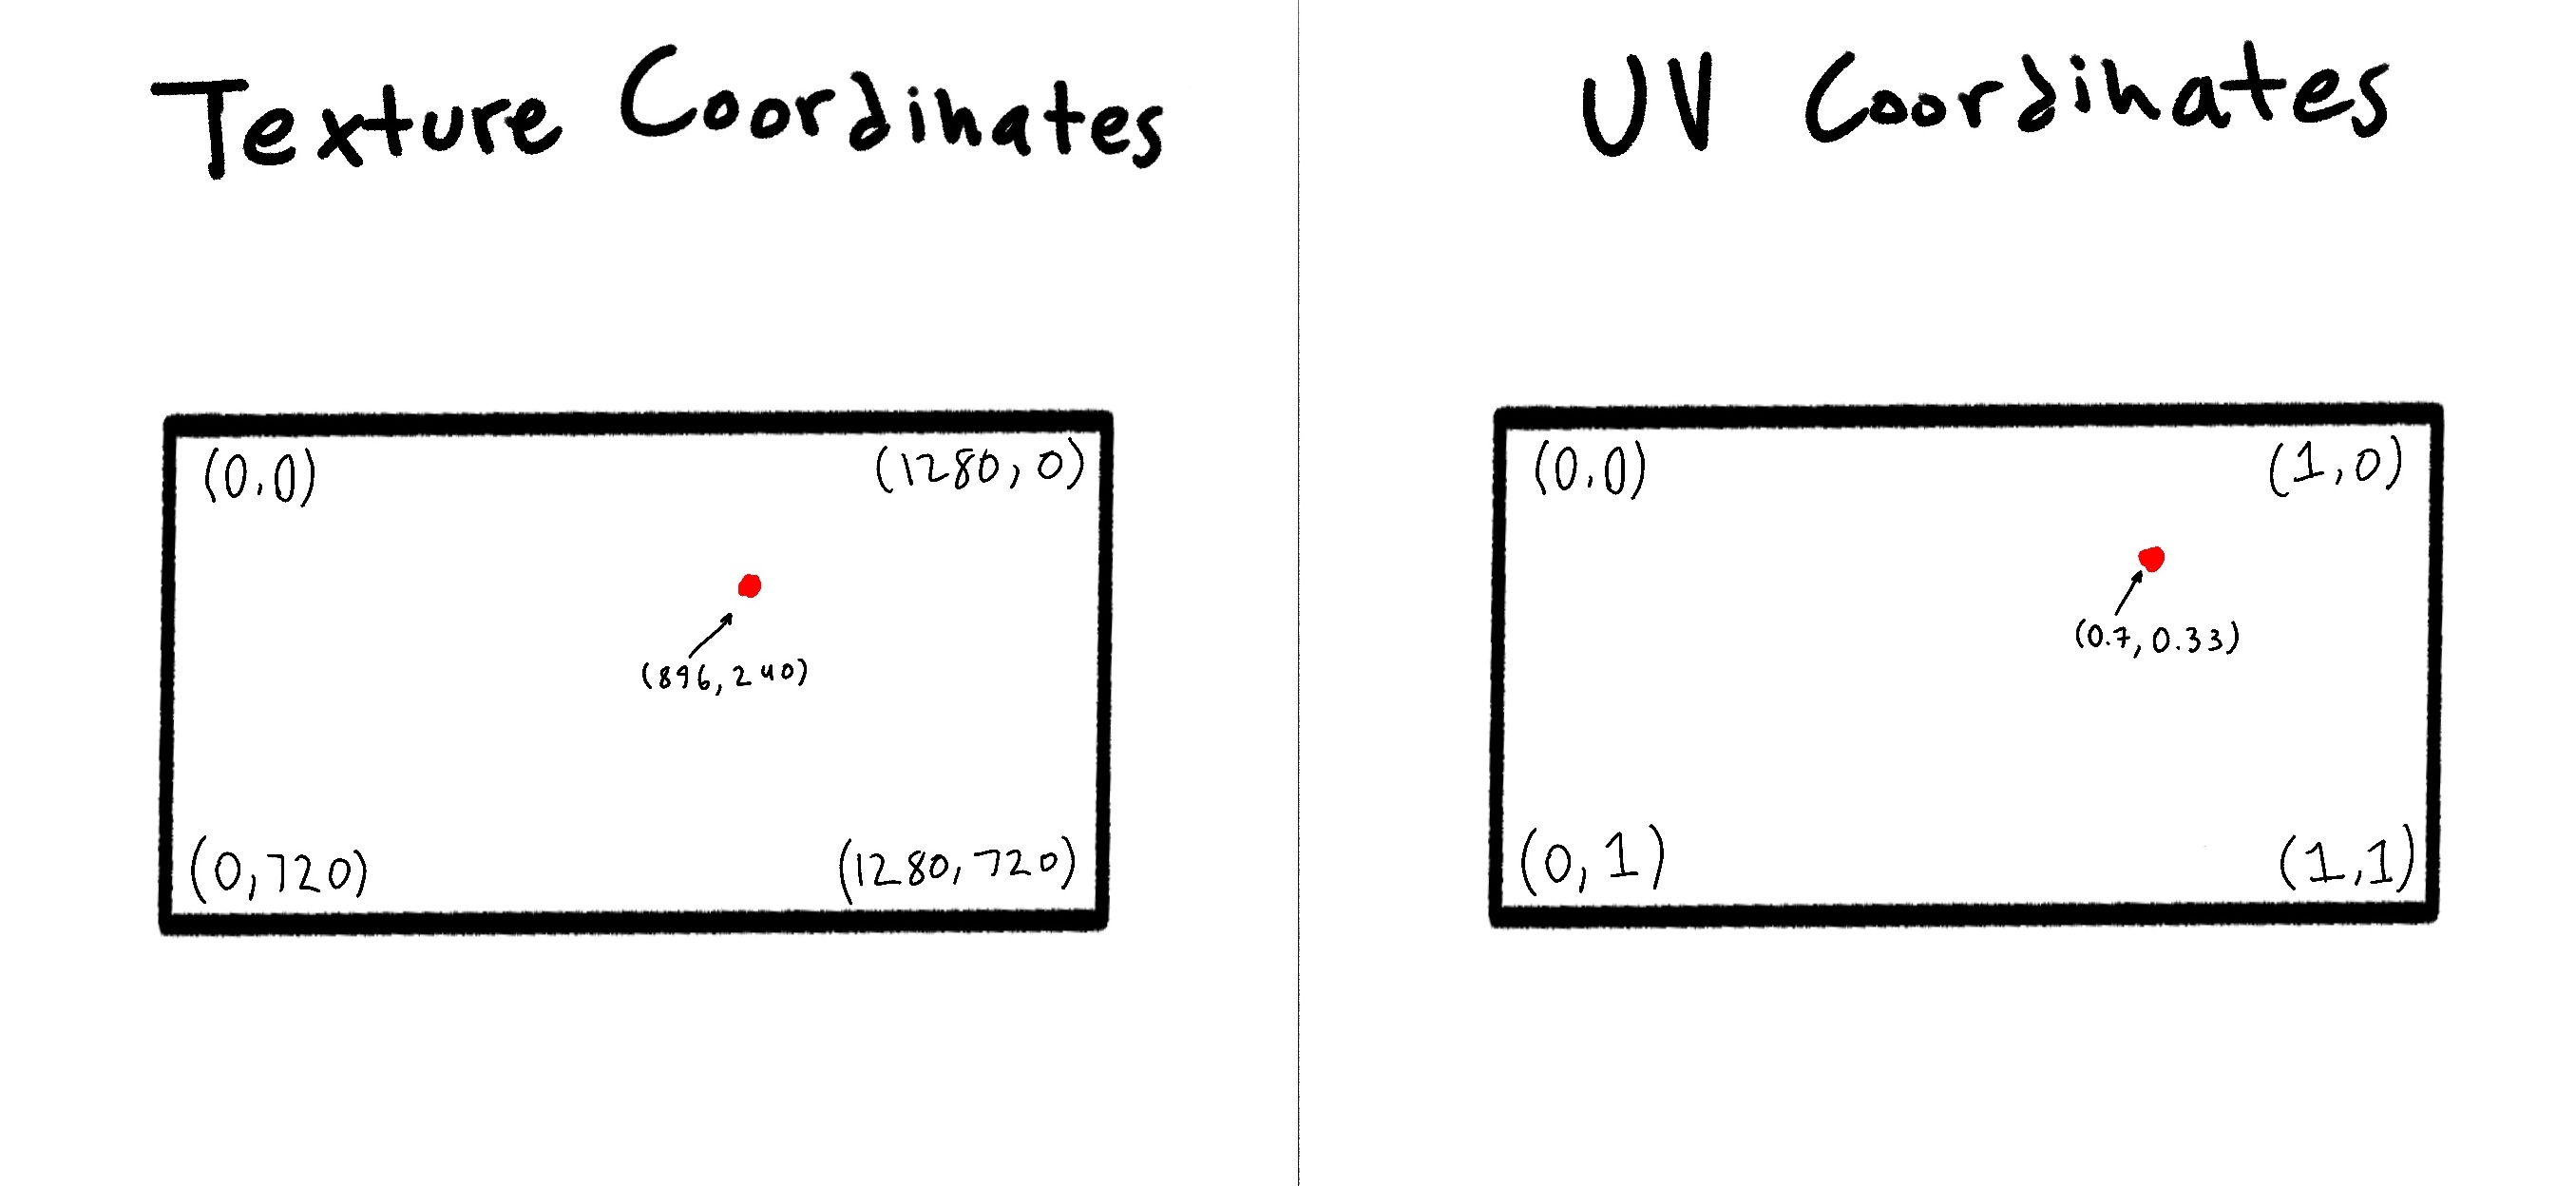
By default we are given the texture coordinate for the pixel, so in this line we just calculate the corresponding UV coordinate.
On to the next line! (Arguably the most important one)
// Output to screen
fragColor = vec4(0.0, 0.0, 0.0, 1.0);
This is the equivalent of "return" ing a value in most other programming languages. fragColor is an special variable in the GLSL language. It stands for the color of the current pixel. It is a vec4 variable that holds the RGBA color.
`fragColor = vec4(RED, GREEN, BLUE, ALPHA);
Alpha is just a fancy word for opacity, so lets keep it at 100% for now
You may be used to writing color out on a range from 0 to 255. But like we did for the UV coordinates, GLSL expects these values to be normalized, so a value of 1 is 100% and 0 is 0%.
When our shader exits execution, the value of fragColor will be applied to the current pixel.
Try modifying your shader to look like this.
void mainImage( out vec4 fragColor, in vec2 fragCoord )
{
    // Normalized pixel coordinates (from 0 to 1)
    vec2 uv = fragCoord/iResolution.xy;

	// Output based on if current pixels x position is greater than 0.5
    if(uv.x > 0.5){
        fragColor = vec4(1.0,0.0,0.0,1.0);
    } else {
	    fragColor = vec4(0.0, 0.0, 0.0, 1.0);
    }
}

Remember that the normalized UV coordinates mean that the halfway line is at x position 0.5, so by coloring pixels who's x UV position is greater than 0.5 red, we get this simple pattern. Try changing 0.5 in the code and seeing what happens.
Another thing you can try is just setting the red value of the fragColor to the pixels UV x coordinate
void mainImage( out vec4 fragColor, in vec2 fragCoord )
{
    // Normalized pixel coordinates (from 0 to 1)
    vec2 uv = fragCoord/iResolution.xy;

    // Output to screen
    fragColor = vec4(uv.x, 0.0, 0.0, 1.0);
}

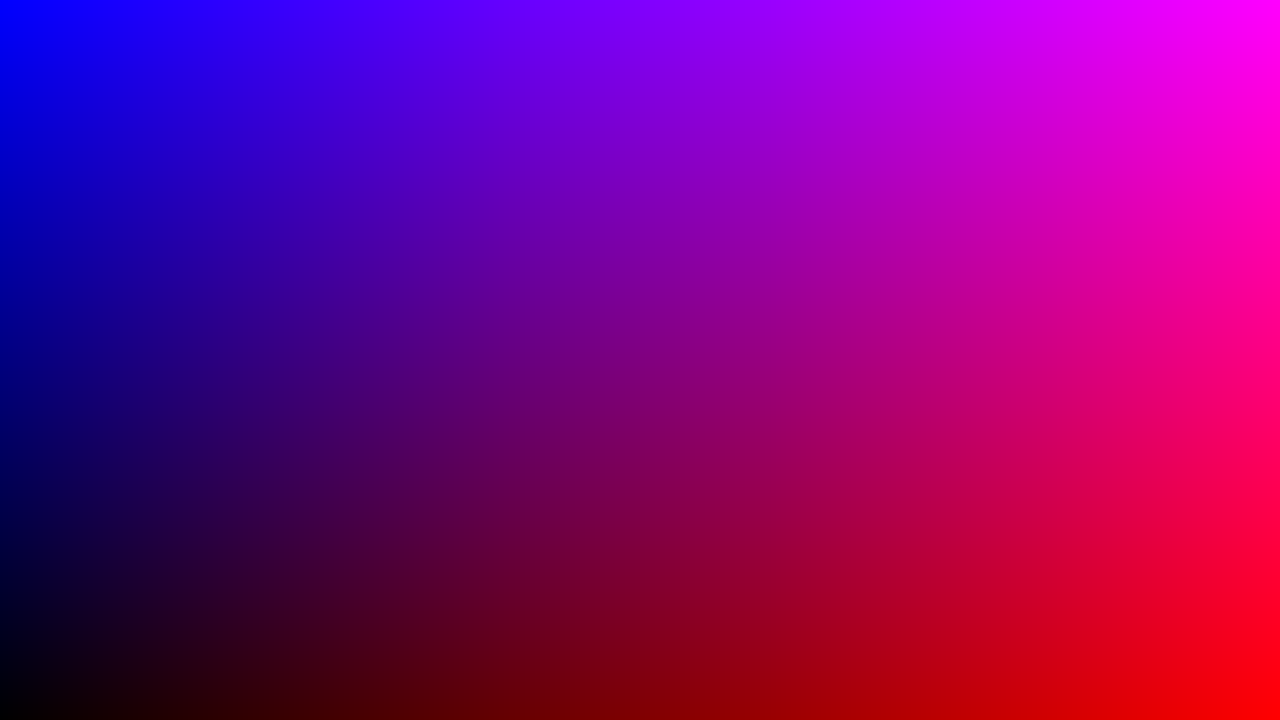
Then you could even set the blue value equal to the pixel UV y coordinate
fragColor = vec4(0.0, 0.0, uv.y, 1.0);

Then combine them into one statement that sets the Red value to the X position and the blue value to the Y position
fragColor = vec4(uv.x, 0.0, uv.y, 1.0);
Coding the Mandelbrot set
Hopefully you're still with me, and hopefully you've either miraculously understood everything up until this point, or you are frantically searching on youtube for a better explanation of the Mandelbrot set(in which case I recommend this one, this one, and The Mandelbrot Set: Atheists’ WORST Nightmare)(Watch that last one at your own risk)
We are dealing with some pretty high level and abstract mathematical concepts here, so if you want to have a solid foundation going into the end of this Jam, make sure you understand the math.
With that said, lets start coding our final product!
Back in ShaderToy, replace the fragColor line and rename the uv variable to c, because thats the name for the current point in the Mandelbrot equation.
void mainImage( out vec4 fragColor, in vec2 fragCoord )
{
    // Normalized pixel coordinates (from 0 to 1)
    vec2 c = fragCoord/iResolution.xy;

    // Output to screen
    fragColor = vec4(0.0, 0.0, 0.0, 1.0);
}
Lets define some constants. First, we need a limit for how many times we want to iterate before deciding if the point explodes out to infinity or stays in a stable orbit. The higher the number, the more accurate the image will be, but the slower our program will be.
// Maximum number of iterations
int maxIterations = 256;
Lets also add our initial Mandelbrot starting point of (0,0)
// Starting point
vec2 Z = vec2(0,0)
We can say our variable c is a complex number with its x component being the real part and y component being the imaginary part, so lets write out a quick helper function to handle the "complex" arithmetic
// Squares a given complex number
vec2 cSquare( in vec2 z )
{
    return vec2(
            z.x * z.x - z.y * z.y,
            2.0 * z.x * z.y
        );
}

void mainImage( out vec4 fragColor, in vec2 fragCoord )
{
    // Normalized pixel coordinates (from 0 to 1)
    vec2 c = fragCoord/iResolution.xy;

    // Maximum number of iterations
    int maxIterations = 256;

	// Starting point
	vec2 Z = vec2(0,0);

    // Output to screen
    fragColor = vec4(0.0, 0.0, 0.0, 1.0);
}
Don't worry too much about this function- Just know that its there because programming languages aren't really designed for complex math. This function just does the math in a way that the computer can understand.
Now it's time to actually implement the Mandelbrot loop. Lets create a for loop in our main function after we define our maxIterations.
for(int i = 0; i < maxIterations; i = i + 1)
{
    // Z(n+1) = Z(n)^2 + C
}
(Also don't worry about the curly braces being indented to the next line its just a thing in GLSL ;)
Now heres where our two functions from earlier come into play.
for(int i = 0; i < maxIterations; i++)
{
    // Z(n+1) = Z(n)^2 + C
    vec2 oldZ = Z;
    Z = cSquare(oldZ) + c;
}
Great! Now we just need to check wether or not the point escapes to infinity. In practice, we don't need to check if it actually gets that far, We can just check if it gets farther that 2 units away from the origin. Thats because all of this beautiful behavior happens on a very small scale so anything that makes it that far is almost definitely heading to infinity.
Add this if statement to the bottom of the for loop
// If the point escapes, color it differently
if(dot(Z, Z) > 4.0) {
    fragColor = vec4(1.0, 0.0, 0.0, 1.0);
    break;
} else {
    fragColor = vec4(0.0, 0.0, 0.0, 1.0);
}
the dot() function is just a way of measuring how far away from the origin the point is.
Re compile and... Nothing! Thats because if we look at the bottom of our code...
		//...
        {
            fragColor = vec4(0.0, 0.0, 0.0, 1.0);
        }
    }

    // Output to screen
    fragColor = vec4(0.0, 0.0, 0.0, 1.0);
}
We change the value of fragColor back to pure black on the last line of the main function. Just delete these lines-
// Output to screen
fragColor = vec4(0.0, 0.0, 0.0, 1.0);
And then we get this image:

...

Fixing visual bugs
Well hey, at least we're making progress! If we compare our image with another render of the set-
We can see several issues
- Framing: We are only seeing a small part of the set
- Stretching: Our image is horizontally compressed
- Color: Ours is ugly
First up, lets fix the stretching. Remember when I talked about converting texture to UV coordinates, here lets look at the picture again real quick
Well the problem is that in our original texture coordinates, the Y axis(height) is 720 pixels, which is 560 pixels shorter than the X axis(width). This is a size difference of 43.75%, while in the UV Coordinates, both the X and Y axis are forced to be the same length, which effectively stretches the Y axis and shrinks the X axis. Not good for our Mandelbrot image.
To fix this, we can just change which axis we choose to use to convert to UV space. Currently, we use both independently
// Normalized pixel coordinates (from 0 to 1)
vec2 c = fragCoord/iResolution.xy;
Instead we can just choose one axis to use to stretch both axis equally. In this case we just use the x axis because of very important reasons(I choose randomly ;)
(In the code just delete the Y at the end of the line)
// Normalized pixel coordinates (from 0 to 1)
vec2 c = fragCoord/iResolution.x;

More progress!
Now for the framing. This is kind of two problems in one, the scale(zoom), and the translation. First, like deal with the scale. We can deal with this by literally changing the plane on which the points are located
// Normalized pixel coordinates (from 0 to 1)
vec2 c = fragCoord/iResolution.x;

// Scale [lower is more zoomed in]
float scale = 4.0;

c *= scale;

And this makes sense when you think about it. Now, our plane is 4 times bigger, so all points are now 4 time farther apart. The smaller this number is(or more accurately, the closer it approaches to zero) the farther we will zoom into the set.
Now for translation. This is pretty simple, we can just directly apply transformations to the point.
// Normalized pixel coordinates (from 0 to 1)
vec2 c = fragCoord/iResolution.x;

// Scale [lower is more zoomed in]
float scale = 4.0;

c *= scale;

// Move set into view
c += vec2(-2.7,-1.1);
I came up with these transformation with trail and error by the way, which is the way that you do a LOT of stuff in GLSL. Unlike more languages, GLSL has zero output other than the end shader result. There is no way to debug a variable, or even console.log() or print()
Now for the fun part.. COLORS!!
Adding color
There are a few ways we can color this set, and we have lots of information about a pixel to use when coloring it, but a really popular way to do it is to follow this flow
- Is the point in the Mandelbrot set?
- Yes: Color that point BLACK
- No: Color that point Based on how many iterations it took before the point escaped to infinity
Luckily we are already doing the calculation in a for loop, so we have access to the variable i, which tells us how many iterations have passed. When we hit the if statement and we have escaped, we can use that variable i to see how many iterations have passed. Lets try making a greyscale image with i being the brightness if the point escapes.
One thing to remember is that we need to normalize the variable first, so we can just divide it by maxIterations
if(dot(Z, Z) > 4.0) {
	// Normalize i for brightness
	float brightness = float(i) / float(maxIterations)

    fragColor = vec4(1.0, 0.0, 0.0, 1.0);
    break;
The cool thing is that vectors have a pretty amazing constructor so if we run vec3(1.0) the constructor will fill in the other two value with the single one provided
a = vec3(1.0) // => vec3(1.0, 1.0, 1.0)
b = vec4(2.4) // => vec4(2.4, 2.4, 2.4, 2.4)

vec4(a, 5.0) // => vec4(1.0, 1.0, 1.0, 5.0)
So lets use that to generate the brightness of the pixel
if(dot(Z, Z) > 4.0) {
    // Normalize i for brightness
    float brightness = float(i) / float(maxIterations);

    fragColor = vec4(vec3(brightness), 1.0);
    break;

CONGRATULATIONS, you just successfully rendered the Mandelbrot set! We still have a few more additions, like color, and camera movements.
Color weights
First, lets explore some different ways of coloring the set. One popular way is to apply different weights to the RED GREEN and BLUE values instead of them all using the same values.
Basically it just means that we can make the RED GREEN and BLUE values increase at different rates, causing more diverse colors.
So to reiterate, currently we are raising the RGB value equally
// Current method. All channels(R G and B) increase at same rate
numIters = 10
RGB(10,10,10)

numIters = 30
RGB(30,30,30)
which means that all the possible values will be different shades of white. Instead of that, we can change how much each RGB value increases based on how much the number of iterations increases
// New method. Apply different weights(mulitpliers) to channels
numIters = 10
RGB(10,8,6)

numIters = 30
RGB(30,20,10)
So lets actually implement that. Add a weights variable and multiply the brightness value by it.
// multipliers for ( R   G   B ) values
vec3 weights = vec3(1.0,1.0,1.0);

fragColor = vec4(vec3(brightness) * weights, 1.0);
break;
Right now, we have the same multiplier for all the value. Lets try making the set more blue
vec3 weights = vec3(1.0,1.0,2.0);

Cool! Now try out some more combinations of weights to color the set.
Tip: try bigger numbers (>10.0)
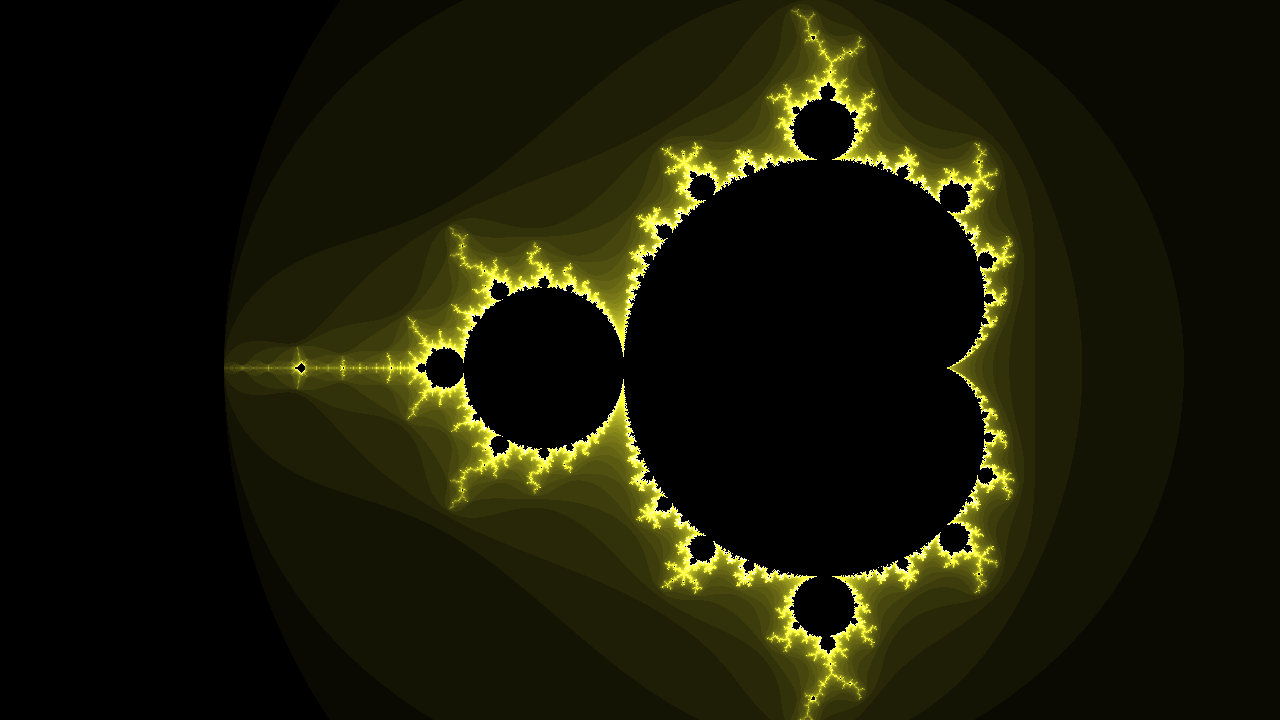
Choose a color that you love, and then we can move onto smooth (log) coloring
Smooth colors
You probably noticed the banding on the image. The brightness values doesn't produce a perfect gradient, instead it steps down in large increments. We can fix this by making use of the double log formula. I'm not going to go into depth on this, but feel free to research it if you want to.
First replace the brightness variable declaration as so
float brightness = (float(i) - log2(log2(dot(Z,Z))) + 4.0) / float(maxIterations);

This doesn't completely fix the problem, because we change the the brightness formula, we need to increase the escape radius as well from 4 to 20.
if(dot(Z, Z) > 20.0) {

!!! BEAUTIFUL !!! Now for my favorite part of the jam
Make it your own
Im going to leave you guys with two more tool that will allow you to create infinite variations of the Mandelbrot set....
- Mutating the Mandelbrot formula
- Using
iTime
Before we do that, heres what our code looks like right now so you can catch up;
// Squares a given complex number
vec2 cSquare( in vec2 z )
{
    return vec2(
            z.x * z.x - z.y * z.y,
            2.0 * z.x * z.y
        );
}

void mainImage( out vec4 fragColor, in vec2 fragCoord )
{
    // Normalized pixel coordinates (from 0 to 1)
    vec2 c = fragCoord/iResolution.x;

    // Scale [lower is more zoomed in]
    float scale = 4.0;

    c *= scale;

    // Move set into view
    c += vec2(-2.7,-1.1);

    // Maximum number of iterations
    int maxIterations = 256;

	// Starting point
	vec2 Z = vec2(0,0);

    for(int i = 0; i < maxIterations; i++)
    {
        // Z(n+1) = Z(n)^2 + C
        vec2 oldZ = Z;
        Z = cSquare(oldZ) + c;

        if(dot(Z, Z) > 20.0) {
            // Normalize i for brightness
            float brightness = (float(i) - log2(log2(dot(Z,Z))) + 4.0) / float(maxIterations);

            // multipliers for ( R   G   B ) values
            vec3 weights = vec3(10.0,10.0,2.0);

            fragColor = vec4(vec3(brightness) * weights, 1.0);
            break;
        } else {
            fragColor = vec4(0.0, 0.0, 0.0, 1.0);
        }
    }
}
Now if you click on the shader inputs drop down directly above the code box...
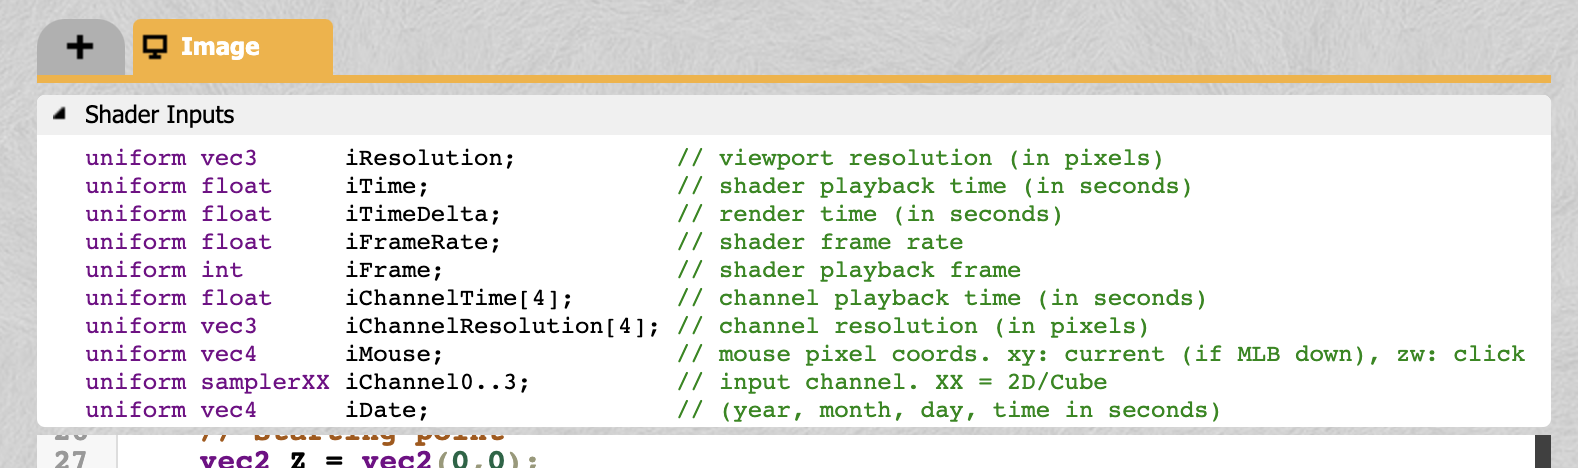
You can see a list of built in variables. These variables provide access to some important information about the current state of our shader.
The most important one is iTime. It returns the current time of the shader animation as a float. It is very powerful when combined with a trigonometric function like sin() cos() and tan().
// multipliers for ( R   G   B ) values
vec3 weights = vec3(sin(iTime) * 2.0 + 5.0, cos(iTime) * 3.0 + 5.0, sin(iTime) * 10.0);

fragColor = vec4(vec3(brightness) * weights, 1.0);
Again, really play around with these values! There are infinite permutations of these functions combined with iTime to explore!
And my personal favorite way to make this yours is to edit the actual Mandelbrot formula. Remember this?
// Z(n+1) = Z(n)^2 + C
vec2 oldZ = Z;
Z = cSquare(oldZ) + c;
Change it to anything. I mean it!! Try messing around with the function, like multiplying c, running cSquare multiple times, inverting variables, adding noise, subtracting value, multiplying by itself, literally anything will give you a unique output. Heres some examples for inspiration.
vec2 oldZ = Z;
Z = cSquare(oldZ + c) + c + cSquare(c * sin(iTime));

vec2 oldZ = Z;
Z = cSquare(c) + c + cSquare(oldZ - sin(iTime));

vec2 oldZ = Z;
Z = cSquare(cSquare(oldZ) + c);

Final Thoughts! + Source Code
Just like everything in this jam... Just play with it! almost everything in this jam can be modified, tweaked, and changed to make this project yours! The best thing about writing this renderer in ShaderToy is that its all real time! No render time to wait, just change something and immediately see its effect. If you want to keep learning, here are some resources and questions to keep learning with
- Try messing with the
cSquare()function. Maybe it doesn't have to "square" the complex number? Change it up randomly (z.y => z.x) - Try increasing / decreasing the max iterations and the escape radius
- What are some other ways that color the set? Try using trigonometric functions...
- I wonder what the
iMousebuiltin variable does.. - Right now we color any points inside the Mandelbrot set black.. How else can we color them?
Finally, I want to leave you guys with 3 ShaderToy links, two of a fully completed example projects, and one of the project in its current state, so you can fork it if you ever got lost along the way. I hope you learned something, and happy hacking!
Example Project, Fully Complete
Congratulations! 🎉 🎉 🎉Share your final project with the community